


Check Out Our New AirLink Air Quality Map
Davis Instruments is proud to bring together a thriving community of professional and amateur meteorologists, climatologists, and weather enthusiasts through the WeatherLink Cloud. We’re excited to announce the launch of the new WeatherLink Air Quality Map.
The addition of the Air Quality overlay to the WeatherLink maps will empower scientists and hobbyists across the globe to build a deeper understanding of outdoor air quality within and across our communities. The best part? Anybody can be part of the effort!
How Do I Access the Air Quality Map in WeatherLink?
The WeatherLink Air Quality Map is incredibly easy to access and use, and you do not need to be an existing Davis customer to view or analyze data.
- Go to WeatherLink.com
- Login using your account, create a free account (no purchase necessary!), or simply click "View Map" if you do not want to create an account at this time
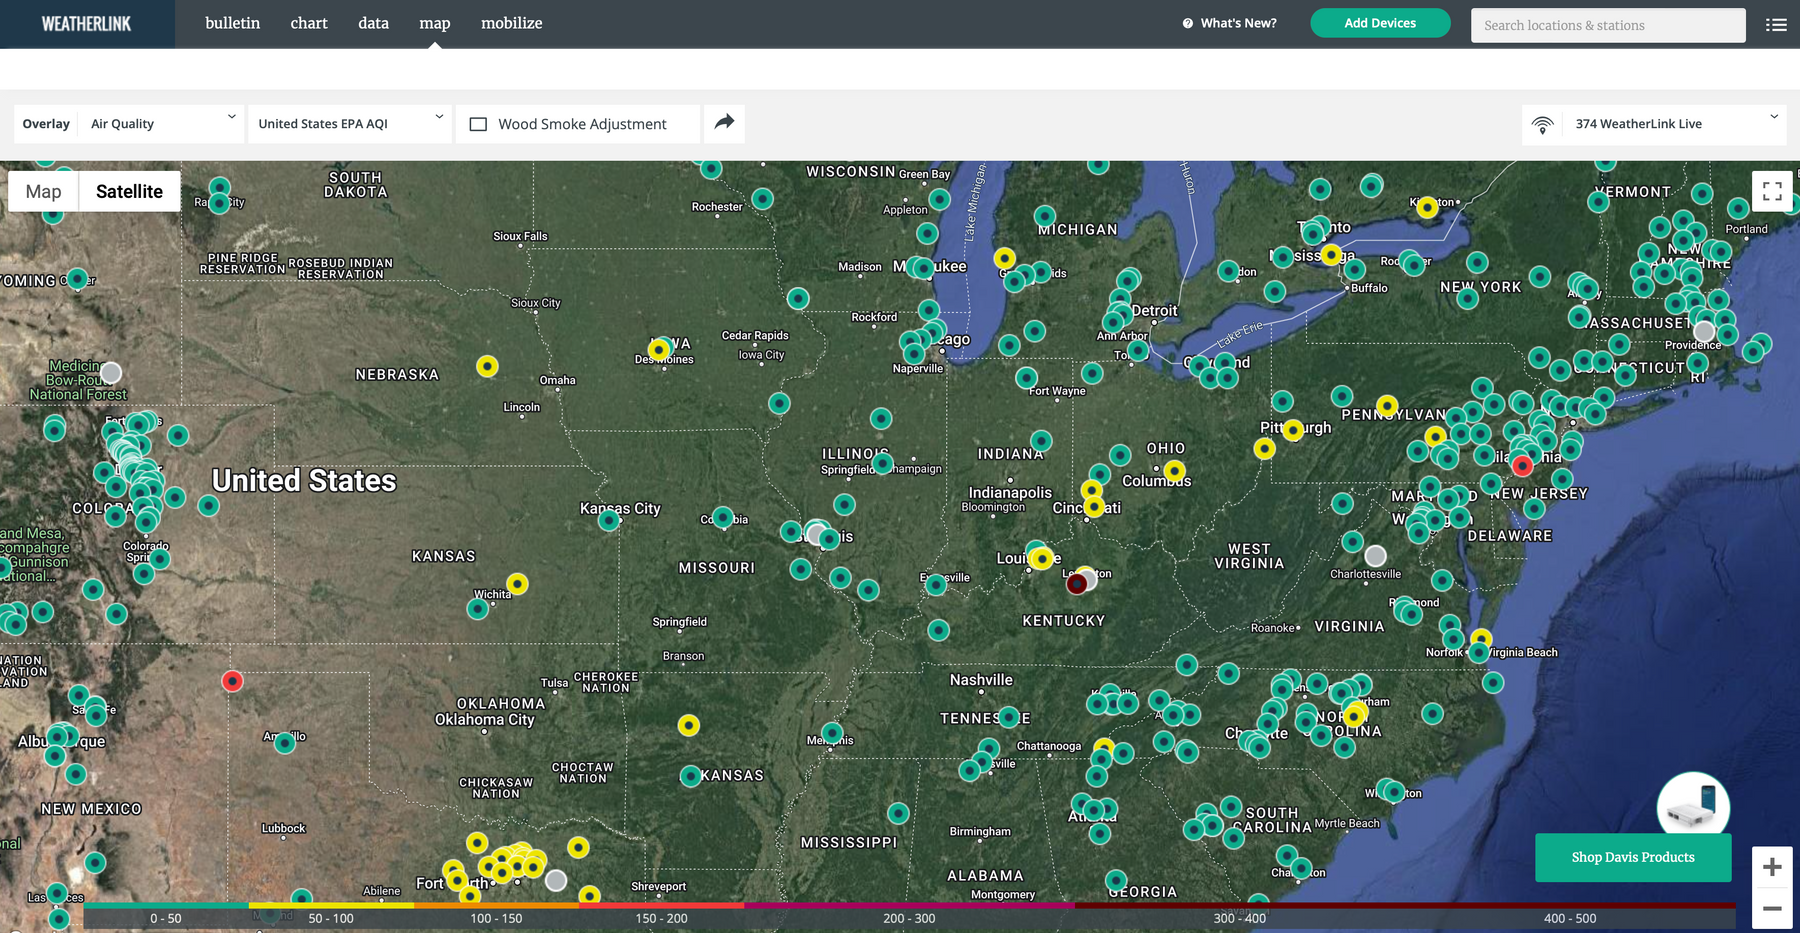
- Once you've logged in (if you have an account), click “Map” in the top navigation
- On the “Overlay” dropdown, select “Air Quality”
- Zoom and pan the map to review air quality data around the world
How Do I Interpret the Air Quality Map?

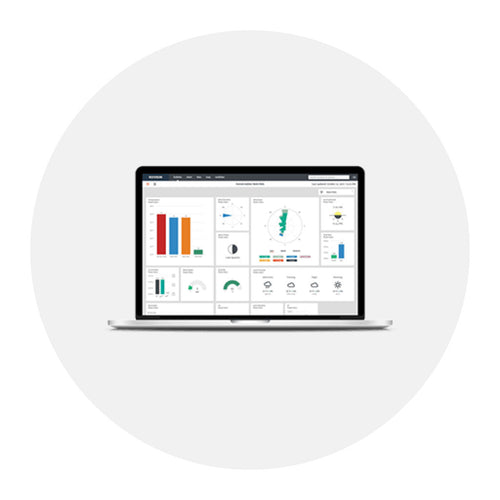
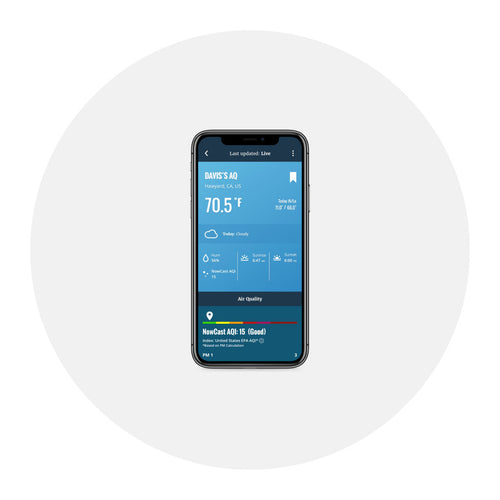
Each circle on the map represents the exact location of a live air quality reading. By clicking on any individual reading, you can get a snapshot look at temperature, humidity, wind, pressure, and recent rainfall conditions as measured by that weather station in addition to the Air Quality Index (AQI).
The color of the circles enables at-a-glance interpretation, with each color corresponding to an AQI range:
- Green: AQI 1-50 (Good)
- Yellow: AQI 50-100 (Moderate)
- Orange: AQI 100-150 (Unhealthy for Sensitive Groups)
- Red: AQI 150-200 (Unhealthy)
- Pink: AQI 200-300 (Very Unhealthy)
- Maroon: AQI 300+ (Hazardous)
Each reading on the map will also include a short summary describing which kinds of people might be at risk there, given the air quality (people unusually sensitive to pollution, with asthma, or even the general population, if the AQI is high enough).

How Does Davis Gather This Data?
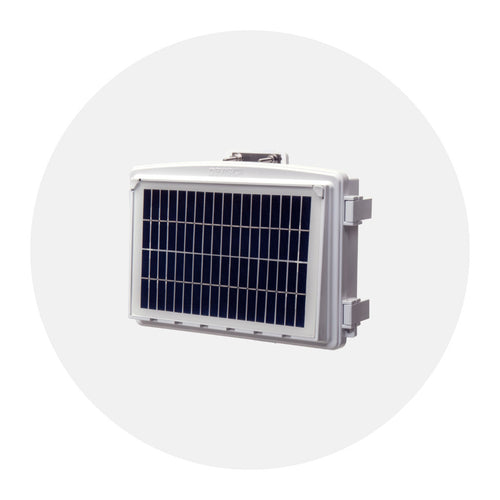
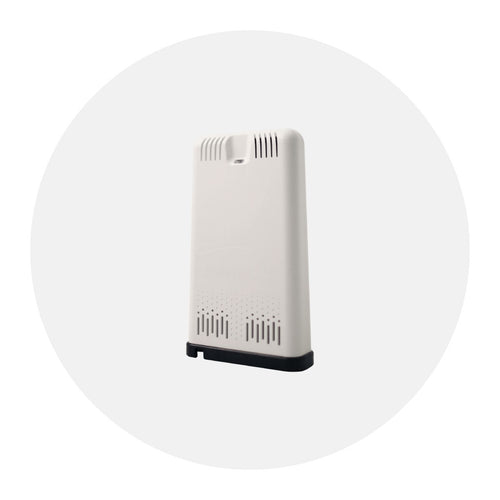
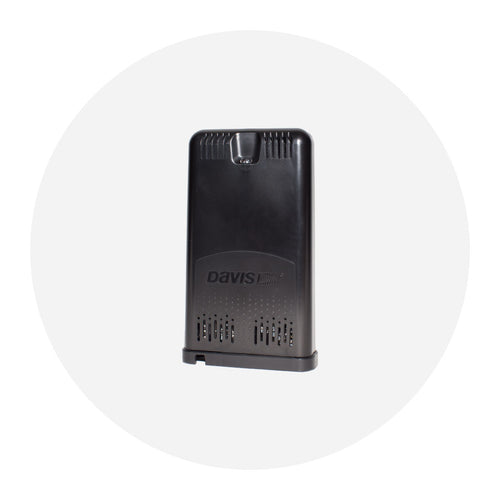
Each reading on the WeatherLink Air Quality Map represents an outdoor AirLink Air Quality Monitor. Each AirLink is Wi-Fi enabled, allowing the device to send live data to WeatherLink Cloud to review and study. All the data points you see on the map are provided thanks to weather enthusiasts who are willing to share their data publicly with our global network.
What Can I Do with the Data from the Map?

There are a variety of useful and exciting ways you can interpret or extrapolate data from the WeatherLink map to better understand air quality, both locally and globally. Here’s a short, non-exhaustive list of ways you can use the map:
Carry Out a Long-Term Comparative Analysis
Want to know how air quality at your house compares to that at grandma’s over the course of a year? Trying to figure out which city in the world experiences the wildest fluctuations in air quality? The WeatherLink Air Quality Map can help you answer those questions! All you need to do is check conditions regularly and maintain a log.
Identify “Hot Spots” in Your Area
If you’re in a richly documented area on the WeatherLink Air Quality Map (such as the U.S., Europe, or Australia), you can compare readings from various stations in your surrounding area to better understand where and why air quality might be low in certain parts of your community. This can be valuable for your own knowledge or in a social science context, where low air quality could be linked to other health or economic factors.
Plan a Trip or Retirement
If you or a loved one has significant allergies, asthma, or other air quality sensitivities, the environment around you can be the difference between having a great time and being miserable. Before you plan a vacation or purchase a new home, you can use the Air Quality Map to determine if the area you’re visiting or moving to is suitable for your family’s respiratory health.
Build a Better Understanding of the Global Community
Air Quality is a major issue affecting people all across the globe. You can explore the WeatherLink map to deepen your understanding of air quality in different places around the world, question your preconceptions about where the “best” and “worst” air are, and gain insights into which communities are prioritizing environmental monitoring.
How Can I Contribute?

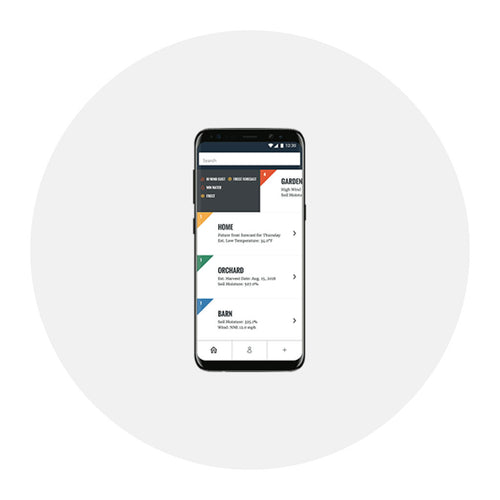
You can begin gathering hyperlocal air quality data and sharing that information with the WeatherLink community by installing a Davis AirLink and configuring it for outdoor use. As soon as you’re connected to the WeatherLink Cloud, you can view live measurements from your AirLink on your phone using the WeatherLink app or computer, by going to WeatherLink.com, and compare those readings to others in your local community, the country, and world.
We’re excited to see our WeatherLink network of professional and amateur weather experts continue to grow and expand, both in numbers and capabilities. Be sure to set up your free account at WeatherLink.com!
![]()
In the face of escalating environmental risks, AEM is the essential source for insights on weather, climate, lightning, floods, wildfires, water management, and more.
Learn more about AEM and all of our solutions here.